It is a well know effect in stock markets: The Santa Claus Rally
From mid of December until the beginning of January stock markets tend to rise.
I made a backtest with Python to prove that this strategy is still working.
Entry Rule
At the 15th of December at market close.
Exit Rule
At the 5th of January at market close
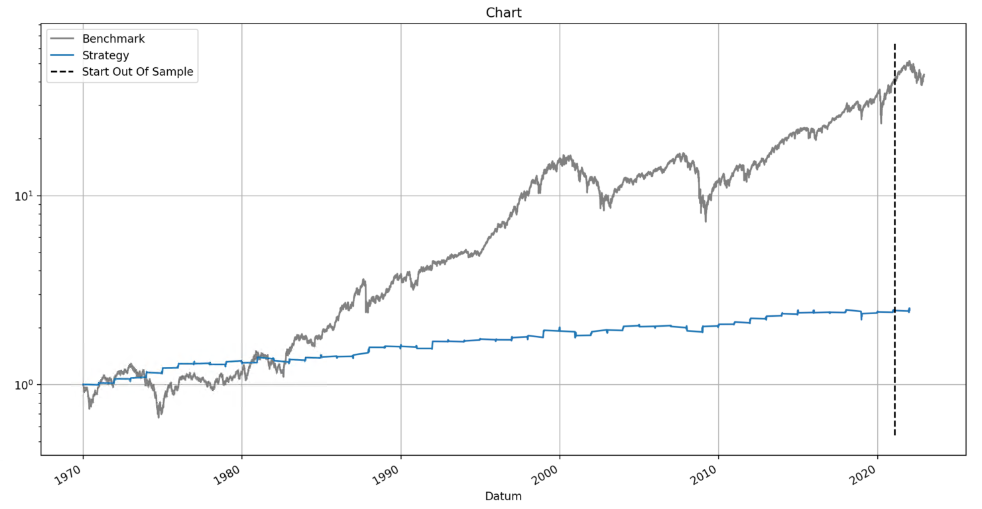
The Equity Curve
In gray the buy and hold curve of the SPX is plotted.
In blue we see the performance curve of the SPX only during the Santa Claus Rally.
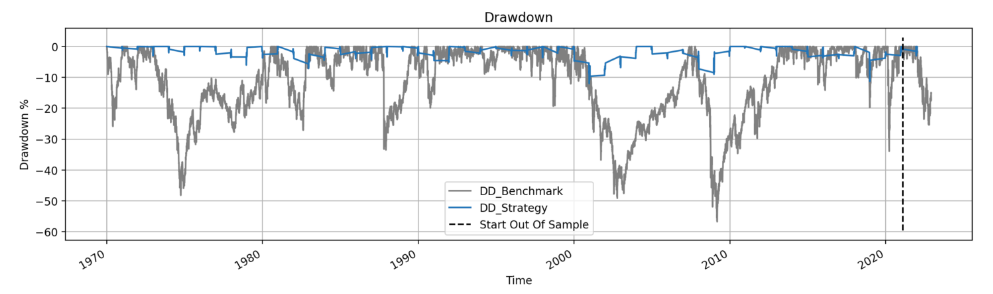
The Drawdown
In gray the buy and hold curve of the SPX is plotted. The Drawdowns are high (up 55% in 2009).
In blue we see the performance curve of the SPX only during the Santa Claus Rally. The Drawdowns decrease to a maximum of 12%. When we are in a Drawdown we reach new All Time Highs faster than buy and hold.
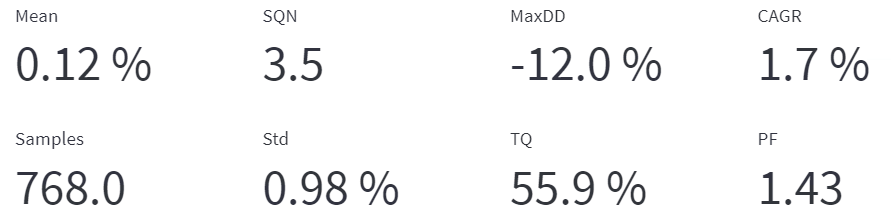
The Metrics
The metrics of this strategy show a strong market effect. During the 3 weeks around Chrismas the SPX makes 1.7% performence (of 8% during the hole year). The SQN is above 3, so we can see this is a strong anomaly. Values above 3 have a very high probability of being successfull in the future.